
The latest Open Doors report confirms falling enrolments for 2025/26 and predicts them for 2026/27. But recent search data points to a more positive story.
The publication of this week’s Open Doors report is an odd moment for those of us working in and around international education. It largely confirms what we felt we already knew (thanks to predictive data from NAFSA and others: namely that the total number of international students in the U.S. has declined for the second year in a row and looks set to do so for a third. Crucially, the number of new international enrolments has declined even more.
But it does confirm it. This is when data stops being predictive and becomes fact. For 2025/26 at least.
I will assume, if you’re interested enough to read this, that you’re broadly familiar with the headline numbers. But here they are, along with a few other data points I’d highlight.
Overall numbers
New international enrolments in the U.S. fell by 18% in 2025/26 and are predicted to fall by a further 15% in 2026/27 based on the Fall Snapshot survey.
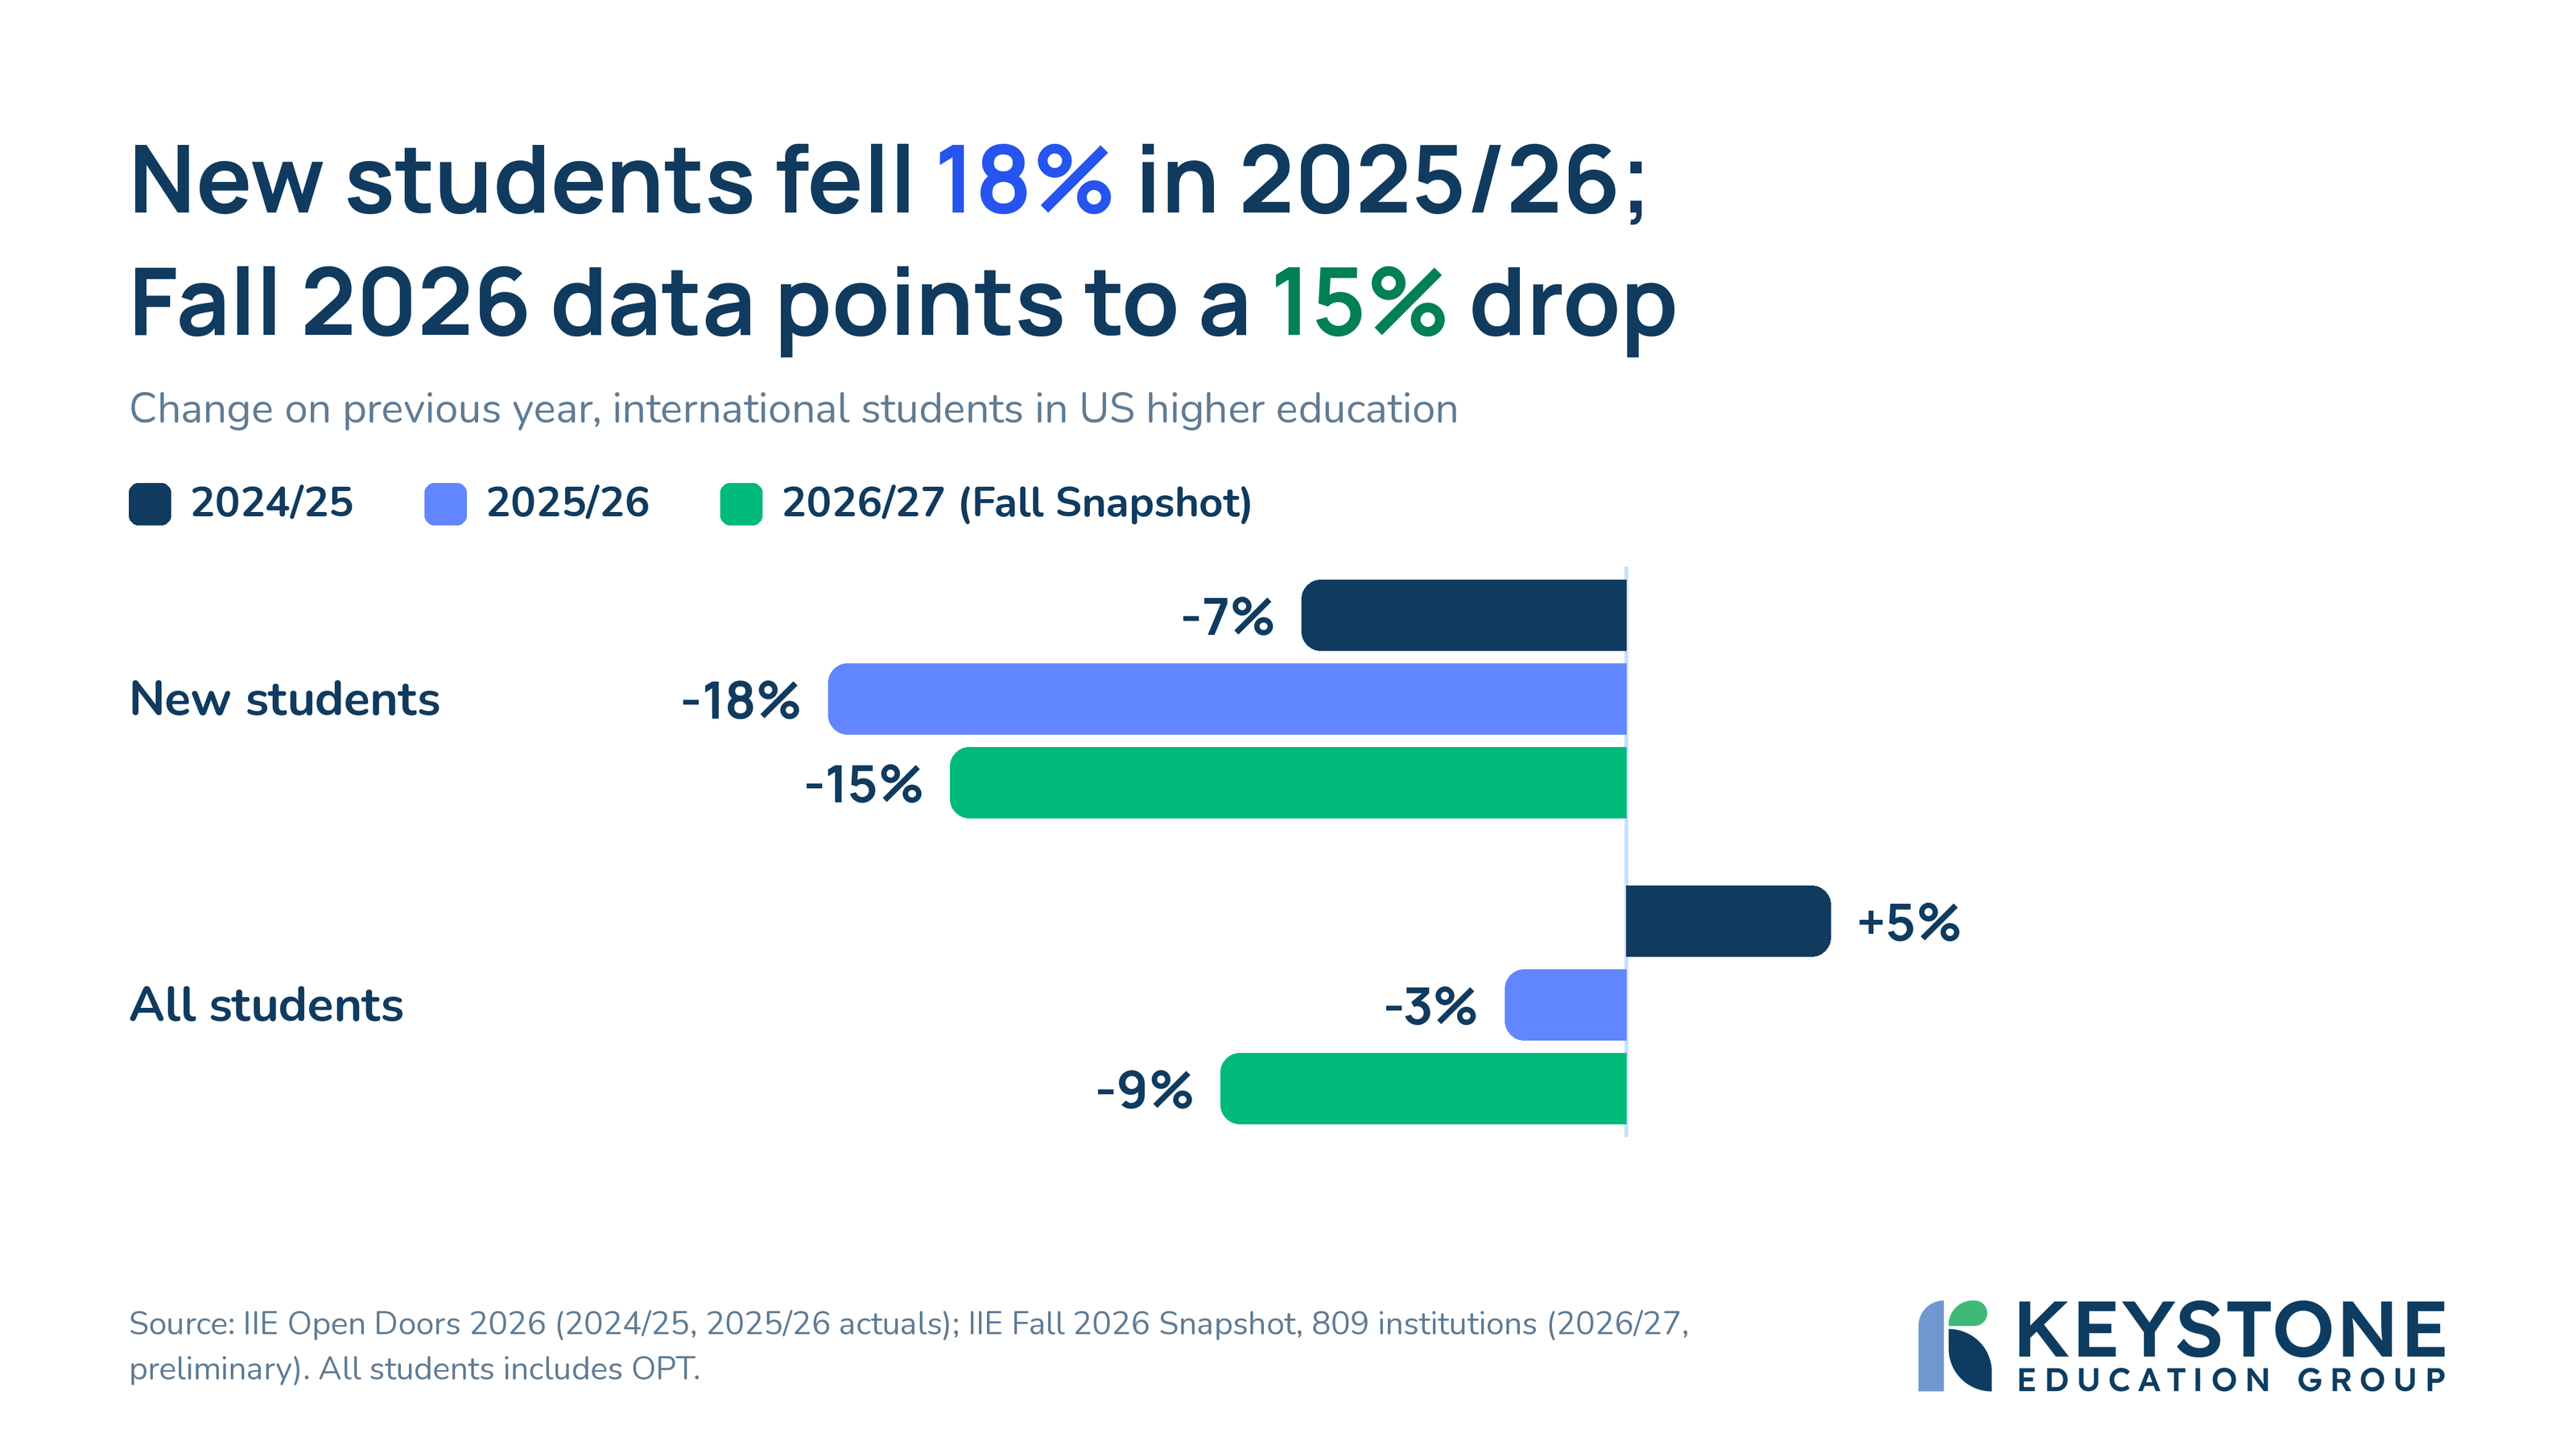
Last year’s Fall Snapshot got the actual 2025/26 trend for this pretty much spot on, so we can be reasonably confident about that -15% for the current / coming year. That’s a concern in so far as it’s another fall, but a slight silver-lining in that the fall has slowed. This is something we’re also seeing in our search data (especially since the U.S. midterms). More on that shortly.
The total number of students in the U.S. hasn’t fallen as far, but that’s largely because of…
The OPT story
The number of international graduates moving on to Optional Practical Training (OPT) (the U.S.’s default post-study-work route) rose again in 2025/26, but it’s predicted to drop in 2026/26:
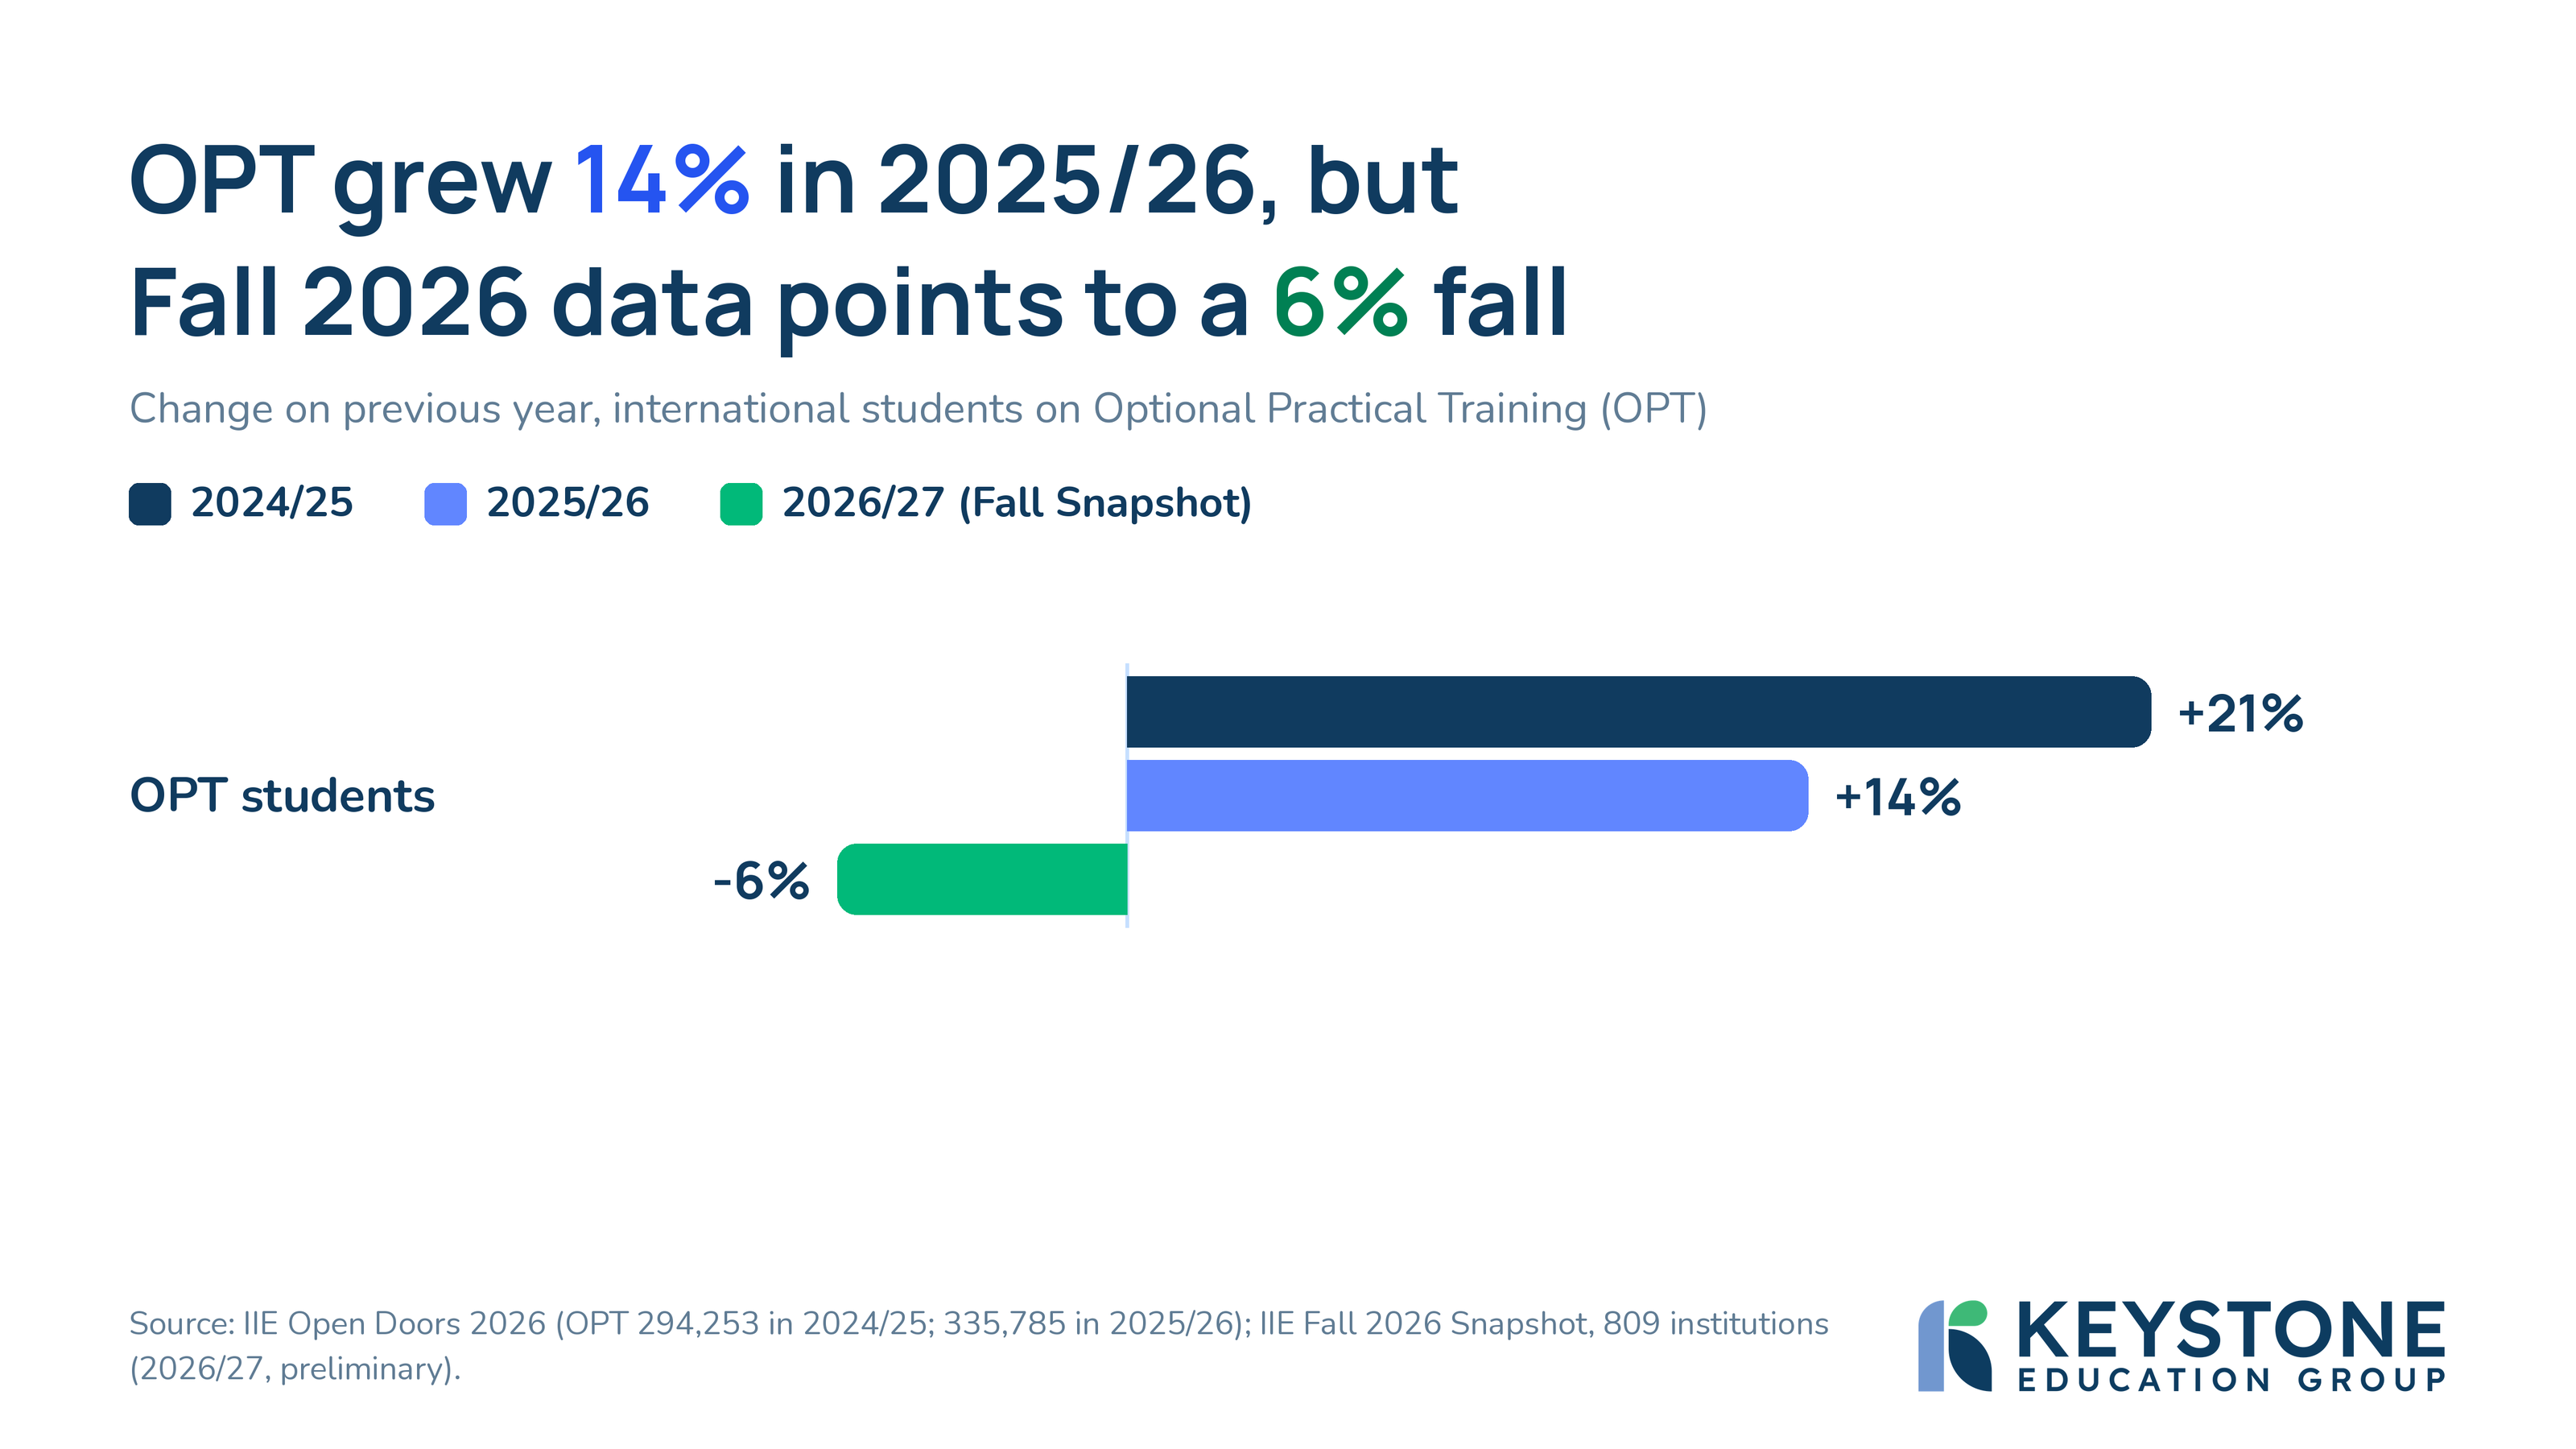
Because OPT numbers are included in total student enrolments (‘All students’ on the previous chart) it helps offset the decline there.
Its own trend is actually very logical: OPT is downstream of study (you have to go and study in the U.S. then graduate to do it). So it rises after historical enrolment growth, even in years when new enrolments aren’t growing. The U.S. saw rising international enrolments between 2021 and 2023 and those graduates push up OPT. New enrolments start to fall from 2024, which means OPT growth slows in 2025/26 and is predicted to reverse in 2026/27.
The wider question is what impact the uncertainty over the future of OPT will have on future enrolments. Participation in OPT looks to have risen during this period: from about 25% of the previous three year’s enrolments taking up OPT in 2022/23 to about 40% in 2025/26. That is a somewhat ropey measurement as students can take varying lengths of time to become eligible for it (depending on how long their degree is) and spend different lengths of time on it (eligible STEM students get a 24-month extension). But regardless, it’s an important part of the U.S. offer.
It’s especially important to one group of students.
Origin patterns
India is now the largest source of international students in the U.S., after overtaking China. The story is the same in the UK, highlighting how important this audience is to established higher education destinations and, frankly, to others.
And it saw the biggest fall amongst large audiences last year.
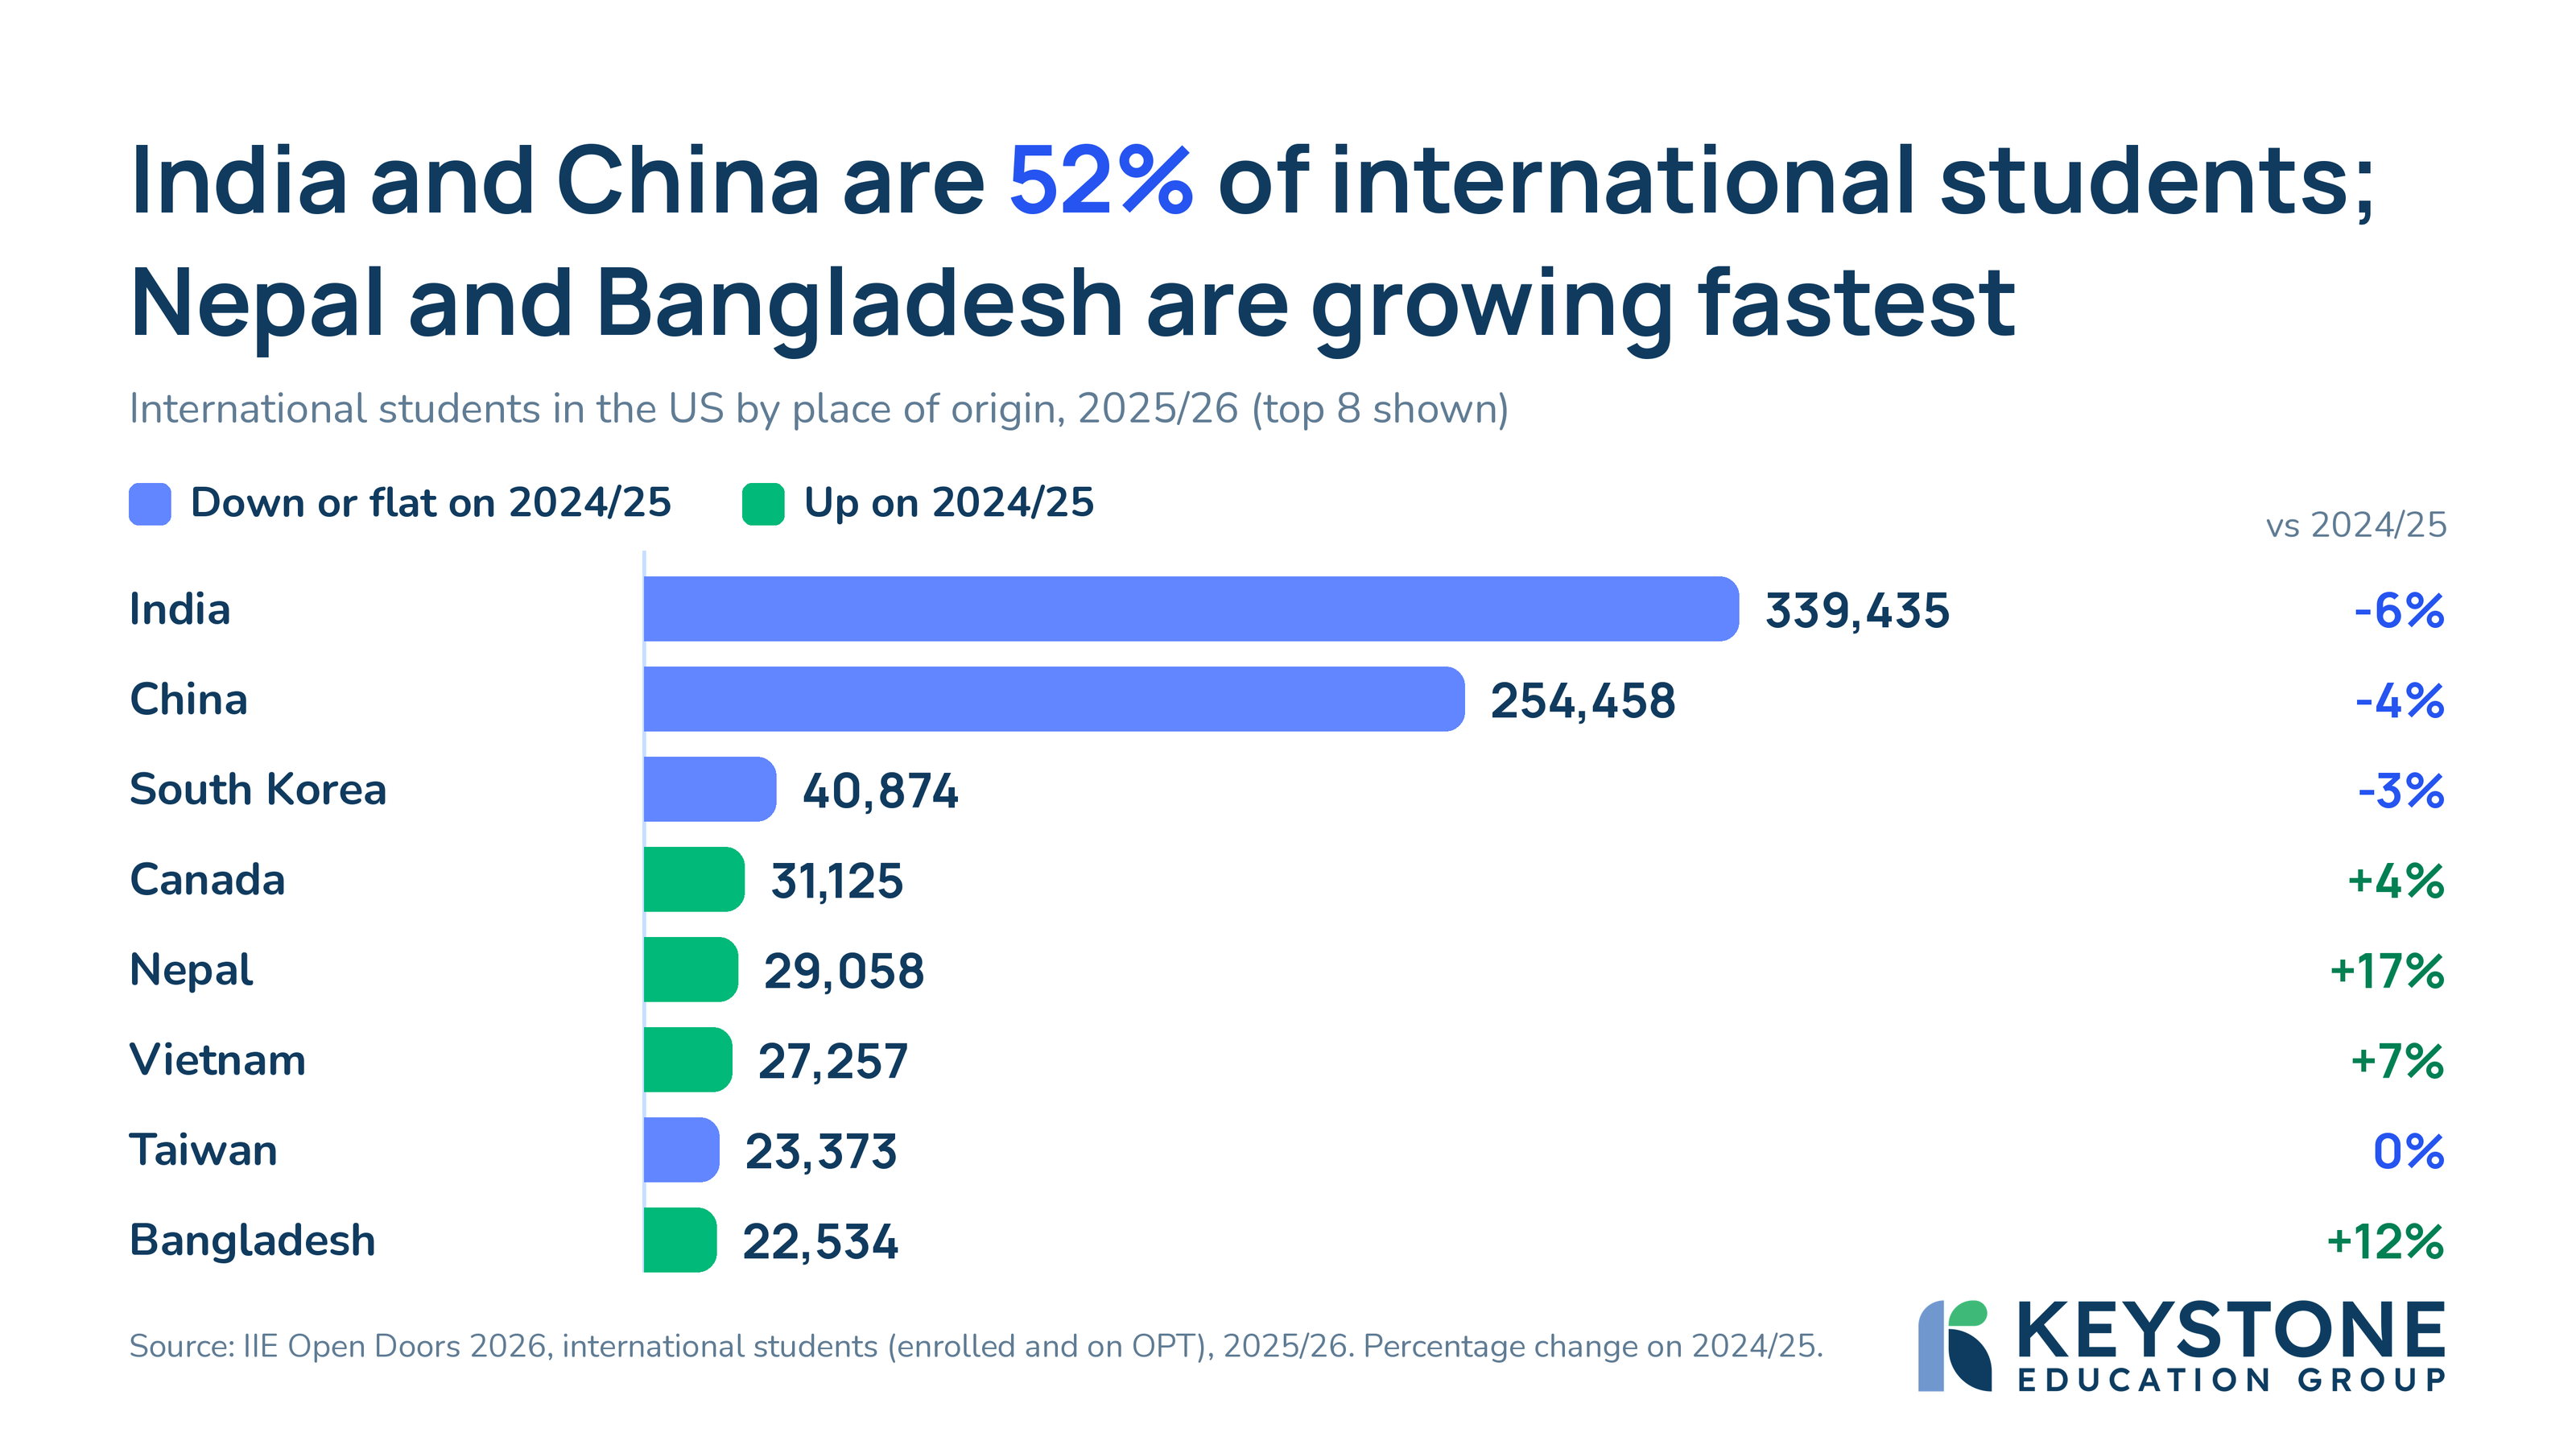
And post-study-work really matters to Indian students. Based on Open Doors 2026 they made up around 30% of all enrolments in 2025/26 and 54% of OPT. This will partly be due to historical growth in Indian enrolment making its way through the system, but it still underlines just how many of this audience go on to post-study-work.
Our own data bears this out. Around 55% of prospective Indian Masters students in our Keystone Pulse data over the past 15 months say they intend to take up post-study-work, compared to only 33% of Chinese respondents.
I’m going to come back to the question of Indian audiences after turning to our search data.
How we got here and where we might be going
Keystone’s Share of Search data tracks relative interest in different destinations over time. Here I’m plotting that for U.S. study at Masters level:
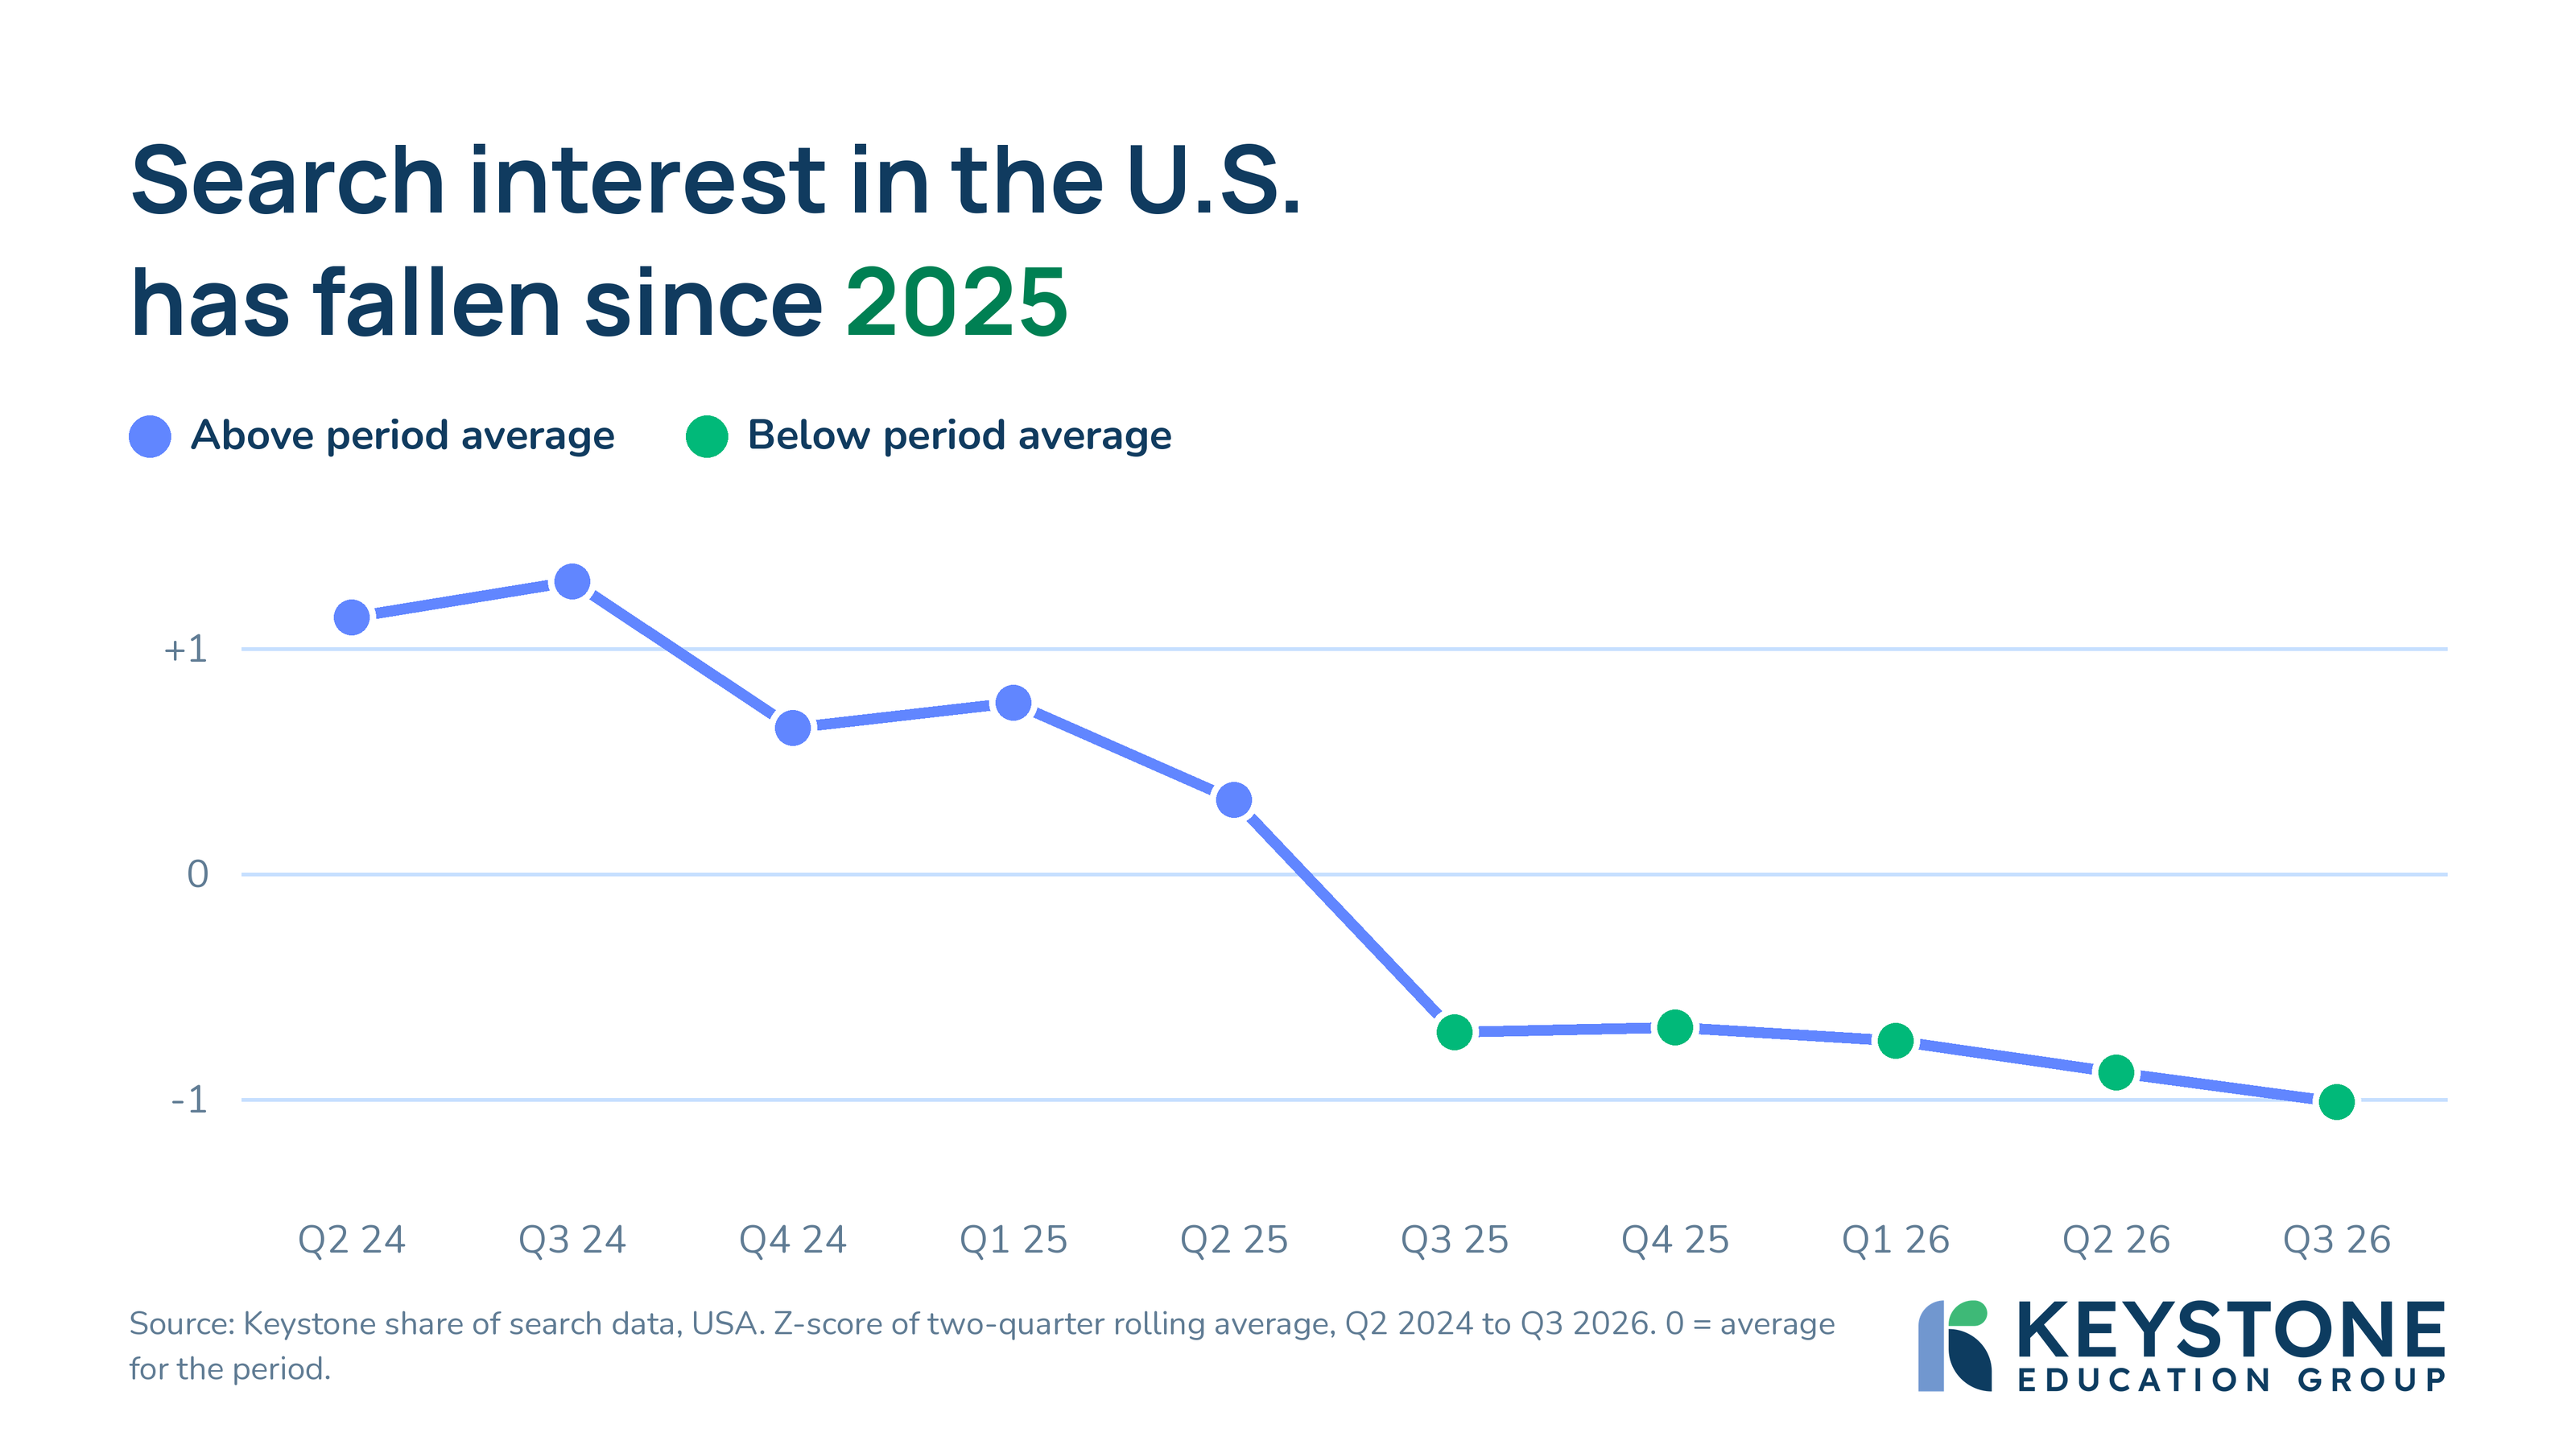
Data compares the direction of interest in the U.S. against the average for this period (a standard deviation). Essentially, it tells you whether interest is rising or falling in this period. The answer is “mostly the latter”. The explanations are well-known and well-discussed – with the 2025 tipping point driven by a myriad of changes to and interventions in the student visa process in Spring 2025.
Of course, this is search data, which is high level, ‘top of funnel’ and prospective. But this year we’ve also seen lower than average progression from viewing a U.S. course to beginning the process of applying for it. As I wrote recently, it’s not just that fewer people are looking in the shop window: less of them are opening the door (pun slightly intended).
What about 2027?
The story for U.S. international education in 2026 is substantially written. Open Doors predicts a -15% drop in its Fall Snapshot and our search trends support that. But things could be starting to change for 2027.
Comparing the two weeks pre- and post- the recent mid-term elections (when the ruling part responsible for many of the changes to international education policy made significant losses) we see that audiences have become 34% more likely to search for U.S. study.
These are early indicators, but two-weeks gives us enough data to see a meaningful and sustained trend. It also lets us see inside that trend and, again, South Asia (including India) is the audience to watch.
Whereas most other large audients see an improvement of 50%+, the figure for South Asia is down at 5%. It’s a positive movement, but it’s much smaller.
And it makes sense given what we see in our ongoing Keystone Pulse survey, which asks prospective international students to rate their chosen destination on a range of factors. The U.S. scores relatively poorly in 2026 data (a pattern we've talked about elsewhere, including in our earlier report on the State of Student Recruitment in the United States). But there's a clear gap for South Asian audiences. In particular, prospective students from India and its neighbours are 16 percentage points less favourable about U.S. visa and entry than audiences overall. And this, as we've seen, is a key topic for that audience.
Cautious optimism
There is good news throughout these stories. It’s good to see that search interest appears to be recovering. It’s good to see that the predicted enrolment fall for 2026 is below that measured for 2025. And it’s good to see that controversial changes to duration of status have been successfully challenged.
2027 could look better, but there’s work to do in reassuring and guiding some audiences in particular. The door may be opening a little wider. Let’s make sure prospective students have what they need to walk through it.